

Types of Solvency Ratios: An Overview
Solvency ratios are a category of financial metrics used to assess a company’s long-term health and its ability to meet its debt obligations. Rather than a single figure, analysts use a suite of ratios to get a comprehensive view from different angles. The primary types include:
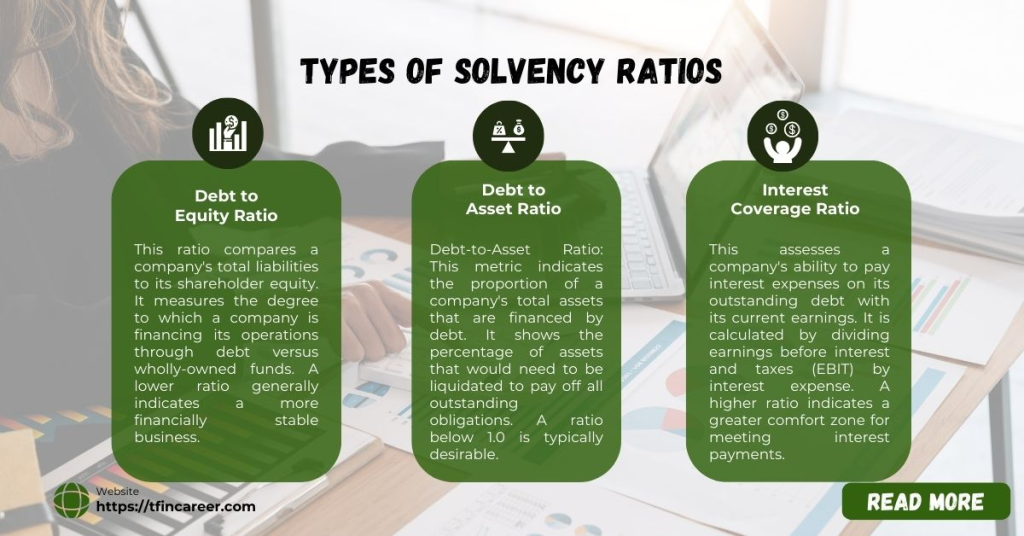
- Debt-to-Equity Ratio: This ratio compares a company’s total liabilities to its shareholder equity. It measures the degree to which a company is financing its operations through debt versus wholly-owned funds. A lower ratio generally indicates a more financially stable business.
- Debt-to-Asset Ratio: This metric indicates the proportion of a company’s total assets that are financed by debt. It shows the percentage of assets that would need to be liquidated to pay off all outstanding obligations. A ratio below 1.0 is typically desirable.
- Interest Coverage Ratio: This assesses a company’s ability to pay interest expenses on its outstanding debt with its current earnings. It is calculated by dividing earnings before interest and taxes (EBIT) by interest expense. A higher ratio indicates a greater comfort zone for meeting interest payments.
- Equity Ratio: This ratio highlights the proportion of a company’s total assets that are financed by shareholders’ equity. It is a direct measure of financial leverage; a higher equity ratio suggests a stronger long-term financial position and less reliance on debt.
In professional practice, these ratios are never used in isolation. They are analyzed collectively, compared against industry benchmarks, and tracked over time to evaluate financial trends and strategic stability.
How Solvency Ratio Is Calculated—With U.S. Context (Explain: calculations)
In insurance, solvency often measures Available Solvency Margin (ASM) against Required Solvency Margin (RSM). A ratio above 150% is considered strong in many systems—but U.S. insurers vary depending on regulatory frameworks.
Another approach: For general businesses, the formula (Net Income + Depreciation) ÷ Total Liabilities gives a solvency ratio, where anything above 20 % signals solid long‑term viability.
