


Understanding Solvency Ratio: A Short Overview
A solvency ratio is a key performance metric used to measure a company’s financial health and its long-term survival. In simple terms, it answers a critical question: “Can this company pay its long-term bills and debts?”
Unlike ratios that only look at short-term liquidity (like having cash for the next month), the solvency ratio examines the bigger picture. It assesses whether a company’s cash flow is sufficient to meet all its financial obligations, including loans that are due years from now.

Think of it like this:
- Liquidity is about having enough money for your groceries this week.
- Solvency is about having a stable enough income to pay your mortgage for the next 20 years.
A strong solvency ratio indicates a stable, financially sound company that is likely to grow. A weak ratio is a major red flag, suggesting the company might be carrying too much debt and could be at risk of defaulting in the future.
Investors and lenders rely heavily on this ratio to judge risk before investing or loaning money. For any business, maintaining a healthy solvency ratio is essential for proving its stability and securing its future.
Also read, How to Use Financial Analysis and Ratios to Drive Strategic Growth
What Is the Solvency Ratio? (Core Concept Explained)

The solvency ratio is a key financial performance metric used to evaluate a company’s capacity to meet its long-term debt obligations and, thus, its long-term financial viability. In essence, it measures whether a company’s cash flow is sufficient to service its total debt and other liabilities, providing a clear indicator of its financial stability and risk of insolvency.
Unlike liquidity ratios, which assess short-term ability to cover immediate obligations, solvency ratios take a comprehensive, long-term view of the capital structure. They determine if a company’s operations are generating enough cash to not only survive but also sustainably grow while managing its debt load.
The ratio is critically important to investors, creditors, and analysts. A strong solvency ratio signals a robust and stable entity capable of weathering economic downturns, while a weak ratio raises a red flag about potential default risk. It is a fundamental gauge of a company’s financial leverage and its strategic balance between debt and equity financing.
Why U.S. Taxpayers Should Care (Explain: relevance to you)
Think about companies you rely on—insurers, utilities, lenders. If solvency is shaky, those services may falter. For taxpayers, robust solvency ratios mean stability in social programs, bailouts, and critical services. When firms falter, the ripple effects land right in your wallet.
Use this Free Finance Calculator Suite: Time Value of Money, Loans, And Investments
Types of Solvency Ratios: An Overview
Solvency ratios are a category of financial metrics used to assess a company’s long-term health and its ability to meet its debt obligations. Rather than a single figure, analysts use a suite of ratios to get a comprehensive view from different angles. The primary types include:
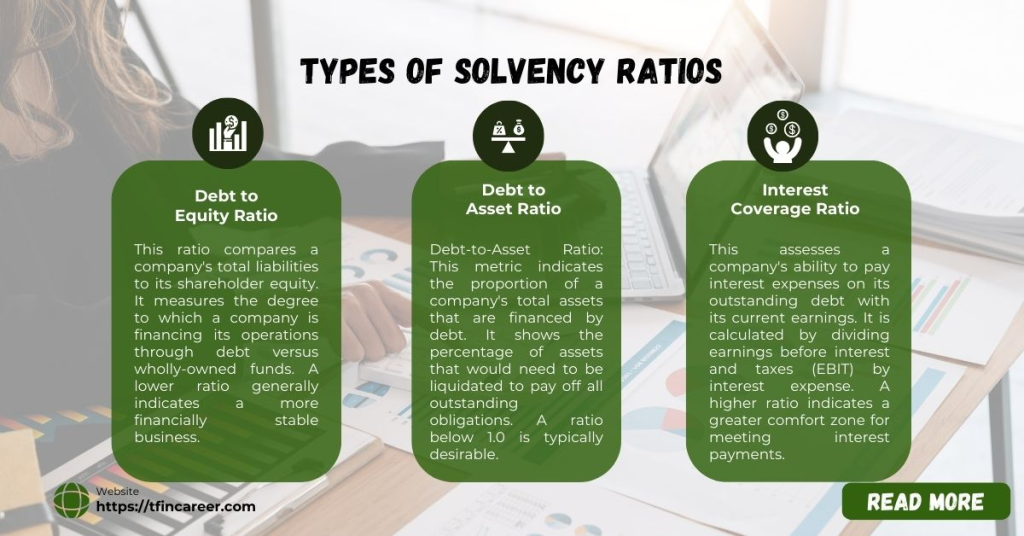
- Debt-to-Equity Ratio: This ratio compares a company’s total liabilities to its shareholder equity. It measures the degree to which a company is financing its operations through debt versus wholly-owned funds. A lower ratio generally indicates a more financially stable business.
- Debt-to-Asset Ratio: This metric indicates the proportion of a company’s total assets that are financed by debt. It shows the percentage of assets that would need to be liquidated to pay off all outstanding obligations. A ratio below 1.0 is typically desirable.
- Interest Coverage Ratio: This assesses a company’s ability to pay interest expenses on its outstanding debt with its current earnings. It is calculated by dividing earnings before interest and taxes (EBIT) by interest expense. A higher ratio indicates a greater comfort zone for meeting interest payments.
- Equity Ratio: This ratio highlights the proportion of a company’s total assets that are financed by shareholders’ equity. It is a direct measure of financial leverage; a higher equity ratio suggests a stronger long-term financial position and less reliance on debt.
In professional practice, these ratios are never used in isolation. They are analyzed collectively, compared against industry benchmarks, and tracked over time to evaluate financial trends and strategic stability.
How Solvency Ratio Is Calculated—With U.S. Context (Explain: calculations)
In insurance, solvency often measures Available Solvency Margin (ASM) against Required Solvency Margin (RSM). A ratio above 150% is considered strong in many systems—but U.S. insurers vary depending on regulatory frameworks.
Another approach: For general businesses, the formula (Net Income + Depreciation) ÷ Total Liabilities gives a solvency ratio, where anything above 20 % signals solid long‑term viability.
Debt-to-Equity Ratio: An Overview
The Debt-to-Equity (D/E) Ratio is a critical solvency metric that compares a company’s total obligations to its shareholder equity. It provides a snapshot of the company’s capital structure and its strategy for financing growth—whether it relies more on debt or owner-funded capital.

Key Explanations:
- Core Purpose: To evaluate a company’s financial leverage and risk profile. It indicates the proportion of creditor financing versus owner financing.
- Risk Indicator: A higher ratio suggests a company is aggressively funding growth with debt, which can be riskier, especially during economic downturns or periods of rising interest rates.
- Benchmarking Context: A “good” or “bad” ratio is entirely dependent on the industry. Capital-intensive industries (e.g., utilities, manufacturing) typically have higher acceptable ratios than service or technology sectors.
Calculative Parts:
The formula for calculating the Debt-to-Equity Ratio is:
Debt-to-Equity Ratio = Total Liabilities / Total Shareholders’ Equity
- Total Liabilities: This includes all short-term and long-term debts and obligations (e.g., loans, bonds payable, accounts payable).
- Total Shareholders’ Equity: This represents the net assets of the company, which remain after subtracting liabilities from assets. It includes items like common stock and retained earnings.
Interpretation Example:
- A ratio of 1.5 means that for every $1 of equity, the company has $1.50 in debt. This is often stated as a debt-to-equity of 1.5x.
- A ratio of 0.8 means the company uses $0.80 in debt for every $1 of equity, indicating a more conservative financial structure.
Debt to Asset Ratio: An Overview
The Debt Ratio is a fundamental solvency ratio that measures the proportion of a company’s total assets that are financed by debt. It provides a clear view of the company’s financial leverage and its long-term ability to meet its obligations.

Key Explanations:
- Core Purpose: To indicate the percentage of a company’s assets that are funded by creditors. A higher ratio means greater leverage and higher financial risk.
- Risk Assessment: It directly shows the cushion available to creditors if the company faces liquidation. A lower ratio is generally associated with greater financial stability and a stronger equity position.
- Strategic Insight: Management and analysts use this ratio to understand the capital structure and make decisions about future borrowing. It is a key factor in creditworthiness evaluations.
Calculative Parts:
The formula for calculating the Debt Ratio is:
Debt Ratio = Total Liabilities / Total Assets
- Total Liabilities: The sum of all short-term and long-term financial obligations owed to creditors.
- Total Assets: The sum of everything the company owns that has value (both current and non-current assets).
Interpretation Example:
- A ratio of 0.60 or 60% means that 60% of the company’s assets are financed by debt. The remaining 40% are financed by owners’ equity.
- A ratio above 1.0 (or 100%) is a major red flag, indicating that the company has more liabilities than assets, which signifies potential insolvency.
- A ratio below 0.5 (or 50%) is typically considered conservative, showing that the company funds more of its assets with equity than with debt.
Interest Coverage Ratio: An Overview
The Times Interest Earned (TIE) Ratio, also known as the Interest Coverage Ratio, measures a company’s ability to meet its interest obligations from its operating earnings. It is a critical indicator of short-term financial health and credit risk.

Key Explanations:
- Core Purpose: To assess how easily a company can cover its interest expenses on outstanding debt with its current operating income. It reflects the margin of safety available to creditors.
- Viability Gauge: A higher ratio indicates a strong ability to service debt, suggesting lower financial risk and a greater capacity to secure additional financing if needed.
- Operating Focus: Unlike ratios based on cash flow, the TIE Ratio uses earnings before interest and taxes (EBIT), focusing on core operational profitability as a source for interest payments.
Calculative Parts:
The formula for calculating the Times Interest Earned Ratio is:
Times Interest Earned Ratio = Earnings Before Interest and Taxes (EBIT) / Interest Expense
- Earnings Before Interest and Taxes (EBIT): This represents a company’s profit from its core operations, excluding the effects of capital structure (interest) and tax jurisdictions. It is often termed “operating income.”
- Interest Expense: The total amount of interest payable on all outstanding debts, including bonds, loans, and lines of credit, for the period.
Interpretation Example:
- A ratio of 5.0x means the company’s operating earnings are five times greater than its annual interest expense. This is generally considered a strong and safe coverage level.
- A ratio of 1.5x indicates earnings are only 1.5 times the interest due, leaving a thin margin for error should earnings decline.
- A ratio below 1.0x is a significant warning sign, as it signifies that the company does not generate sufficient operating profit to cover its interest payments.
Benefits of Solvency Ratios: An Overview
Solvency ratios are indispensable tools for stakeholders to assess a company’s long-term financial stability and its capacity to meet debt obligations. Their benefits extend across various aspects of financial analysis and strategic decision-making.

Key Benefits:
- Risk Assessment for Creditors and Investors:
These ratios provide a clear measure of a company’s financial leverage and default risk. A strong solvency position signals lower risk, making the company more attractive for loans or investments. - Strategic Financial Management:
Management uses these ratios to make informed decisions about capital structure—balancing debt and equity to fund operations and growth optimally without overleveraging. - Long-Term Viability Indicator:
Unlike liquidity ratios, solvency ratios focus on long-term health, indicating whether a company can sustain operations and grow while managing its debt over time. - Benchmarking Performance:
Companies can compare their ratios against industry peers to gauge competitive standing and identify areas for improvement in financial strategy. - Early Warning System:
Deteriorating solvency ratios can serve as red flags, prompting early corrective actions to avoid financial distress or bankruptcy.
Calculative Insight (Using Debt-to-Equity Ratio as an Example):
The formula for the Debt-to-Equity Ratio is:
Debt-to-Equity Ratio = Total Liabilities / Shareholders’ Equity
- Interpretation: A ratio of 0.6 means creditors fund 60% of assets for every dollar of equity, indicating moderate leverage. Conversely, a ratio of 2.0 implies high leverage, where debt finances twice the amount of equity, raising risk concerns.
Practical Example:
If a company has $500,000 in total liabilities and $1,000,000 in shareholders’ equity:
Debt-to-Equity Ratio = $500,000 / $1,000,000 = 0.5
This indicates a conservative financial structure with low reliance on debt.
Conclusion:
Solvency ratios offer a multifaceted view of financial health, enabling stakeholders to make proactive, data-driven decisions that enhance stability and foster sustainable growth.
Also read this related topic – Why the US. Inflation Matters—and How to Protect Your Cash
Differences in Solvency, Liquidity, and Viability: An Overview
While often used interchangeably, solvency, liquidity, and viability are distinct financial concepts that address different aspects of a company’s financial health. Understanding their differences is crucial for a comprehensive financial analysis.

Key Explanations:
- Liquidity:
- Focus: Short-term financial position (within one year).
- Core Question: “Can the company pay its immediate bills and short-term obligations as they come due?”
- Key Ratios: Current Ratio, Quick Ratio.
- Analogy: Having enough cash in your wallet to cover your daily expenses.
- Solvency:
- Focus: Long-term financial stability and capital structure (beyond one year).
- Core Question: “Can the company meet its long-term debt commitments and avoid bankruptcy?”
- Key Ratios: Debt-to-Equity Ratio, Debt Ratio, Times Interest Earned.
- Analogy: Having a stable income and manageable mortgage payments to ensure you won’t go bankrupt in the future.
- Viability (or Profitability):
- Focus: Earning capacity and operational efficiency.
- Core Question: “Is the company generating sufficient profit from its core operations to sustain itself and grow?”
- Key Ratios: Net Profit Margin, Return on Equity (ROE), Return on Assets (ROA).
- Analogy: Having a successful, profitable business that provides a steady income stream.
Summary of Differences:
| Aspect | Liquidity | Solvency | Viability (Profitability) |
| Time Frame | Short-Term | Long-Term | Ongoing / Periodic |
| Primary Focus | Immediate Obligations | Debt & Capital Structure | Earnings & Operational Efficiency |
| Key Question | Can we pay our bills now? | Can we survive long-term? | Are we profitable? |
Calculative Parts (Illustrative Examples):
- Liquidity (Current Ratio):
Formula: Current Ratio = Current Assets / Current Liabilities
Example: A ratio of 1.5 means the company has $1.50 in short-term assets to cover every $1.00 of short-term debt. - Solvency (Debt-to-Equity Ratio):
Formula: Debt-to-Equity Ratio = Total Liabilities / Total Shareholders’ Equity
Example: A ratio of 0.6x indicates a conservative structure where creditors finance $0.60 for every $1.00 provided by shareholders. - Viability (Net Profit Margin):
Formula: Net Profit Margin = (Net Income / Revenue) * 100
Example: A margin of 15% means the company generates $0.15 in profit from every dollar of revenue earned.
Conclusion:
A healthy company must successfully manage all three areas:
- Liquidity to operate day-to-day,
- Solvency to endure for years, and
- Viability to generate profits and grow.
A weakness in any one area can threaten the overall stability of the business, which is why analysts examine all three categories of ratios.
Conclusion: A Comprehensive Overview of Solvency Analysis
This overview has detailed the critical components of solvency analysis, a cornerstone of evaluating a company’s long-term financial health. Here is a consolidated summary of the key points covered:

1. Core Concept of Solvency:
- Purpose: Solvency ratios measure a company’s capacity to meet its long-term debt obligations and sustain operations indefinitely.
- Key Differentiator: Unlike liquidity (short-term bill payment), solvency assesses the long-term balance between debt and equity financing, determining if a company can survive and grow without excessive financial risk.
2. Primary Types of Solvency Ratios:
A robust analysis uses a suite of ratios for a complete picture:
- Debt-to-Equity Ratio: Compares total debt to shareholder equity to gauge financial leverage.
- Calculation: Total Liabilities / Shareholders’ Equity
- Example: $500,000 / $1,000,000 = 0.5x (Low leverage, conservative structure)
- Debt Ratio: Shows the proportion of assets financed by debt.
- Calculation: Total Liabilities / Total Assets
- Example: $500,000 / $1,500,000 = 0.33 or 33% (33% of assets are debt-funded)
- Times Interest Earned (TIE) Ratio: Assesses the ability to cover interest payments with operating earnings.
- Calculation: EBIT / Interest Expense
- Example: $200,000 / $40,000 = 5.0x (Strong ability to service debt)
3. Critical Benefits and Applications:
- Risk Management: Provides creditors and investors with a clear measure of default risk.
- Strategic Decision-Making: Guides management in optimizing capital structure (debt vs. equity).
- Performance Benchmarking: Allows for comparison against industry standards to evaluate competitive standing.
4. Distinction from Liquidity and Viability:
Understanding how solvency fits into the broader financial landscape is essential:
- Liquidity: Short-term focus (Can we pay bills now?) using ratios like the Current Ratio.
- Solvency: Long-term focus (Can we pay all debts forever?) using the ratios above.
- Viability/Profitability: Ongoing focus (Are we making money?) using ratios like Net Profit Margin.
Read from Investopedia – What Is a Solvency Ratio, and How Is It Calculated?
Final Synthesis:
A company’s financial strength cannot be determined by a single metric. True stability requires a balance:
- Adequate Liquidity to ensure smooth daily operations.
- Strong Solvency to secure long-term survival and foster trust with lenders.
- Sustainable Viability to generate profits and fund future growth.
By collectively analyzing these ratios, stakeholders can form a complete, forward-looking view of a company’s financial resilience and strategic potential, making solvency analysis an indispensable tool for informed decision-making.
This overview has detailed the critical components of solvency analysis, a cornerstone of evaluating a company’s long-term financial health. Here is a consolidated summary of the key points covered:


Hi there! I am Sudip Sengupta, the face behind “Tfin Career”. Tfin Career is a sole proprietorship finance and consulting firm that makes complex tax and financial concepts easy to understand for everyone. With more than 21 years of experience in the field, I have noticed that people cannot make the right decisions in this field. So, I decided to create “Tfin Career” to help individuals and businesses alike. Here I urge those who are confused to make better choices. Also, it is good news for my dear clients and every visitor that I/we are going to start a training module for those who want to choose a career path in Finance and Taxation. Just follow my website.
Thank you for reading this post, don't forget to subscribe!